
How Much Water Does Your Tank “Drink” Every Day? ULS‑03GW Draws a Household Water Usage Bill for You
From “gut feeling” to “data‑driven” – how historical data analysis makes liquid level management truly smart
In daily use, the core need for liquid level monitoring is often reduced to a single question: “How much water/oil is left?” But what really troubles users goes far beyond the current level – questions like “How much do I use per day?”, “How often do I need to refill?”, “Why has my usage suddenly increased?”, “Is there a hidden leak?” Traditional liquid level monitors can hardly answer any of these.
1. The Data Shortcomings of Traditional Liquid Level Monitors
The vast majority of conventional sensors (float switches, electrode sensors, optical sensors, etc.) only provide discrete switching signals – “water present / absent” or “limit reached / not reached”. They have no data logging or storage capability, let alone historical trend analysis.
Pain points for users:
Pain Point 1: You only know the “now”, not the “past”
A float switch can only tell you “there’s still enough water” or “it’s empty now”. But you have no way of knowing:
- How much water was consumed each day over the past week?
- When was the last refill, and how long did it take to drop to low level?
- What are the peak usage hours?
Pain Point 2: Abnormal consumption goes unnoticed
If there is a tiny leak in a pipe or an oil drum valve is not fully closed, the level drops at an abnormal rate. Traditional switch‑type sensors only trigger an alarm when the level hits the lower limit – by then, the leak may have been ongoing for hours or even days, and waste has already occurred.
Pain Point 3: No way to optimize usage habits
Without knowing how much water you use daily for showers, laundry, and cooking, you cannot save water effectively. Without knowing oil consumption patterns, you cannot plan refill cycles intelligently – you either over‑stock or run out unexpectedly.
Pain Point 4: Troubleshooting lacks evidence
When equipment behaves abnormally (frequent pump cycling, dry‑heating alarms), you cannot tell whether it’s caused by level fluctuations or a sensor failure. Without historical data to look back on, troubleshooting is just guesswork.
Pain Point 5: Chaotic management of multiple containers
If you have several tanks (rooftop water tank, water purifier storage, rainwater collection), traditional solutions cannot log level changes for each container centrally. You have to remember each one separately – easy to get confused or miss something.
2. ULS‑03GW’s Data Advantages: Continuous Logging, Smart Analysis
The ULS‑03GW not only provides real‑time continuous liquid level data but also makes historical data logging and analysis a core feature – completely filling the data gap left by traditional products.
| Comparison | Traditional Sensors | ULS‑03GW |
|---|---|---|
| Data type | Discrete (on/off) | Continuous % + value |
| Historical storage | None | Automatic cloud storage |
| Trend viewing | Not available | Day/week/month/year curves |
| Abnormal consumption detection | None | Automatic comparative analysis |
| Usage statistics | None | Automatic consumption calculation |
| Multi‑container unified view | Not supported | One app for all |
Core Advantage 1: Continuous level monitoring – full visibility
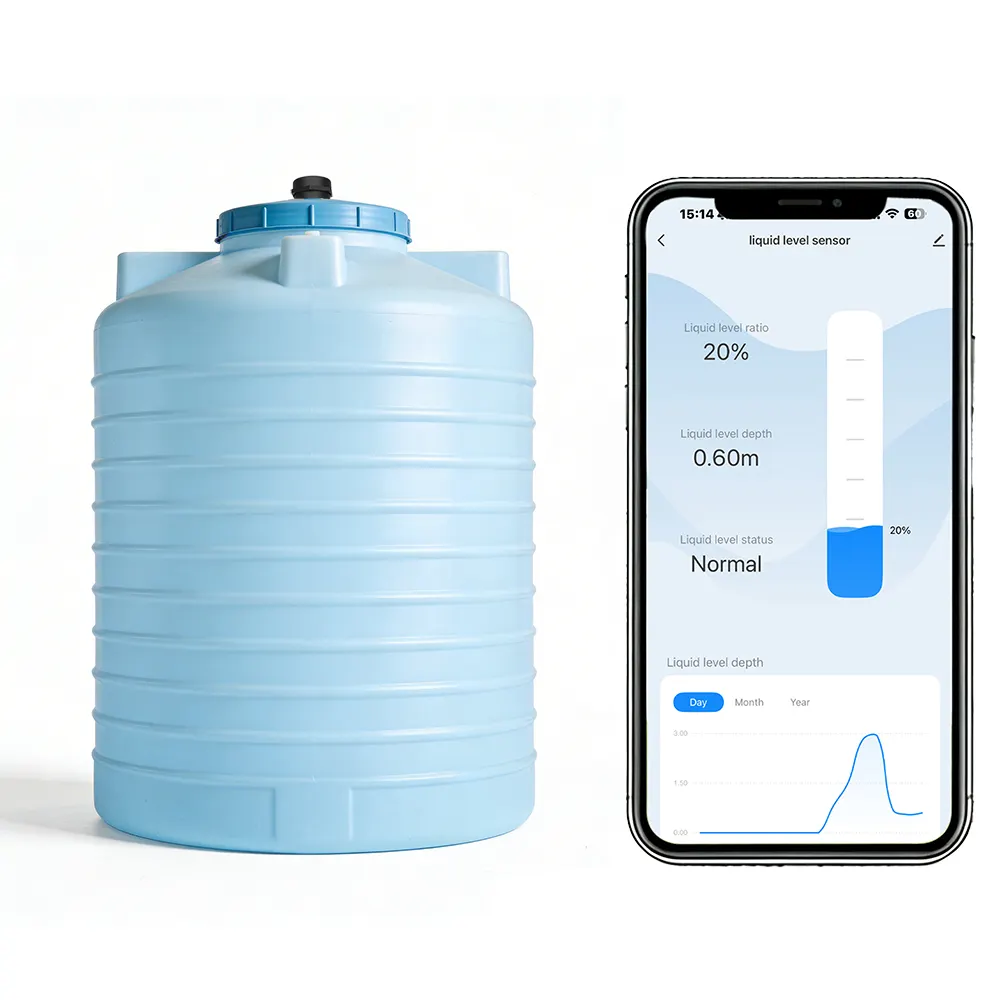
The ULS‑03GW continuously measures liquid level height via ultrasound, displayed in real time as a percentage + actual distance value. Every centimeter from empty to full is captured precisely. You not only know “how much is left” – you also see “how fast it is dropping”.
Core Advantage 2: Automatic cloud logging – revisit anytime
All level data is automatically uploaded to the Tuya Smart Life cloud platform – no manual recording needed. You can view on the app at any time:
- Daily curve – level fluctuations over the past 24 hours
- Weekly curve – water/oil usage patterns over a week
- Monthly curve – long‑term consumption trends
- Yearly curve – seasonal comparisons
Core Advantage 3: Smart usage statistics – always know where you stand
The ULS‑03GW automatically calculates and displays:
- Today’s consumption – how much used today
- This week’s cumulative consumption – total for the week
- This month’s cumulative consumption – clear monthly picture
- Refill cycle recommendations – automatically estimates next refill time based on historical consumption rate
Core Advantage 4: Automatic abnormal consumption alerts
When the system detects that the level drop rate is significantly faster than the historical average (e.g., normally 20L per day, but suddenly dropping 5L per hour), the app sends a “suspected leak / abnormal consumption” alert. This helps users identify pipe leaks, unclosed valves, or equipment failures immediately, preventing larger losses.
Core Advantage 5: Unified dashboard for multiple containers
Within a single app interface, you can manage multiple ULS‑03GW devices simultaneously, viewing real‑time levels and historical curves for each container. Give each container a custom name (“Rooftop Tank”, “Purifier Tank”, “Frying Oil Drum”) – all data at a glance.
3. How Does Data Solve Real User Problems?
Scenario 1: Discovering a hidden leak
Ms. Zhang’s rooftop water tank showed a sudden 30% increase in monthly water usage. Checking the ULS‑03GW historical curve, she noticed a slow but continuous level drop during late night hours (1‑5 AM) – when no one in the house was using water. Based on this finding, she inspected her toilet tank and balcony faucet, eventually finding a worn float valve causing a micro‑leak. After repair, her water bill returned to normal.
Without historical data – She would only know that “the bill is higher” but never find the cause, and the leak could continue for months or even a year.
Scenario 2: Optimizing refill cycles to avoid shortages
Mr. Li’s small restaurant uses the ULS‑03GW to monitor his frying oil drum. Reviewing the weekly consumption curve, he discovered that weekend oil usage was 2.5 times higher than weekdays. He adjusted his purchasing schedule from “fixed weekly refill” to “refill on Wednesday and again on Friday” – and never ran out of oil on weekends again.
Without historical data – He would have to guess, either over‑stocking (oil goes bad) or facing sudden shortages that hurt his business.
Scenario 3: Verifying energy‑saving improvements
Mr. Wang installed water‑efficient showerheads and wanted to see the actual effect. He compared the level drop curves for two weeks before and after installation – daily consumption dropped from ~80L to 55L. The water saving was clearly visible. He used the data to convince his family, and everyone developed better water‑saving habits.
Without historical data – He could only say “I think we saved a bit” – impossible to quantify or use to persuade others.
Scenario 4: Remote care for elderly parents living alone
Ms. Liu’s parents live alone in their hometown. She installed an ULS‑03GW on their water tank. By remotely checking the daily water usage curve, she saw that their consumption pattern was stable – indicating they were healthy and living normally. One day the curve showed an anomaly (sharp drop in usage). She called immediately and learned that her father had caught a cold and was bedridden – allowing her to arrange care in time.
Without historical data – She would have to call regularly, disturbing her parents and possibly missing early signs of trouble.
4. Competitive Comparison: Why Other “Smart” Level Monitors Fall Short
There are some Wi‑Fi level monitors on the market, but most have the following limitations:
| Competitor Limitation | How ULS‑03GW Surpasses |
|---|---|
| Shows only current level, no history | Automatic cloud storage – revisit anytime |
| History shows only last few readings | Full day/week/month/year curves |
| No usage statistics | Automatic consumption calculation |
| No anomaly detection | Automatic leak/abnormal consumption alerts |
| Requires manual data logging | Fully automatic, zero effort |
| Multi‑container data scattered across different apps | Unified dashboard, centralized management |
5. Conclusion
The value of liquid level monitoring goes far beyond “alerting when water is low”. True intelligence is when data works for you – helping you discover hidden problems, optimize habits, quantify savings, and even care for loved ones from a distance.
The ULS‑03GW, built on continuous level monitoring and powered by cloud‑based historical data, completely closes the data gap that has plagued traditional products – the inability to see, remember, or analyze.
Starting today, let your tank “speak” – you will know exactly how much water it “drinks” every day.
ULS‑03GW: Redefining liquid level management with data.