
How to Test and Calibrate a Smart Propane Tank Monitor for Unmatched Accuracy
Introduction: The High Cost of an Inaccurate Tank Reading
Let’s be honest: when your smart propane tank monitor is wrong, it’s not just an inconvenience—it’s a major risk factor. In the commercial and light industrial sector, trusting a faulty reading is an express ticket to unnecessary emergency fills, costly run-outs that shut down production lines, or, worst of all, an accidental overfill situation during a scheduled delivery. In my experience working with factory floor operations and commercial kitchens, a single propane run-out event can cost a business upwards of $10,000 per hour in downtime. That’s why relying solely on a blinking light on an app just doesn’t cut it.
If your tank monitor is consistently giving you suspicious numbers, you’re in the right place. The primary goal of this guide is to give you a clear, actionable process to test and validate your smart propane monitor's accuracy. We’re going deeper than simply rebooting your app. We'll look at the technical process, the critical variables, and the specific instances where a professional service technician must perform true calibration on the device’s firmware. We’ll cut through the noise so you can trust your tank reading again.
The Critical Difference: Validation vs. True Calibration
Here’s where most generic articles fall short. They treat "testing" and "calibrating" as the same thing, but in the world of industrial instrumentation, they are distinctly different. Understanding this is key to knowing whether you can fix the issue yourself or if you need to call your supplier.
Validation (What You Can Do)
Validation is the process of confirming that the smart monitor's reading matches the known, true volume of gas in the tank. It’s essentially a "sanity check" or a test for accuracy. Since the smart monitor is a secondary measuring device that mirrors the primary physical float gauge, validation involves cross-referencing the physical gauge reading with the monitor’s digital reading. You are checking the monitor’s performance against a known standard.
True Calibration (What the Manufacturer/Technician Does)
True calibration is the adjustment of a sensor's internal algorithm or firmware to ensure its raw output correctly corresponds to the physical variable being measured. In the case of a smart monitor, this means a technician uses proprietary software to program the monitor to correctly interpret the voltage or frequency signal it receives from the sensor and convert it into an accurate percentage or gallon volume for that specific tank.
In short: you validate its performance; a technician calibrates its programming.
Propane Tank Strapping Charts: The Algorithmic Backbone
Why is calibration so complex? Because a propane tank isn't just a simple, perfect cylinder.
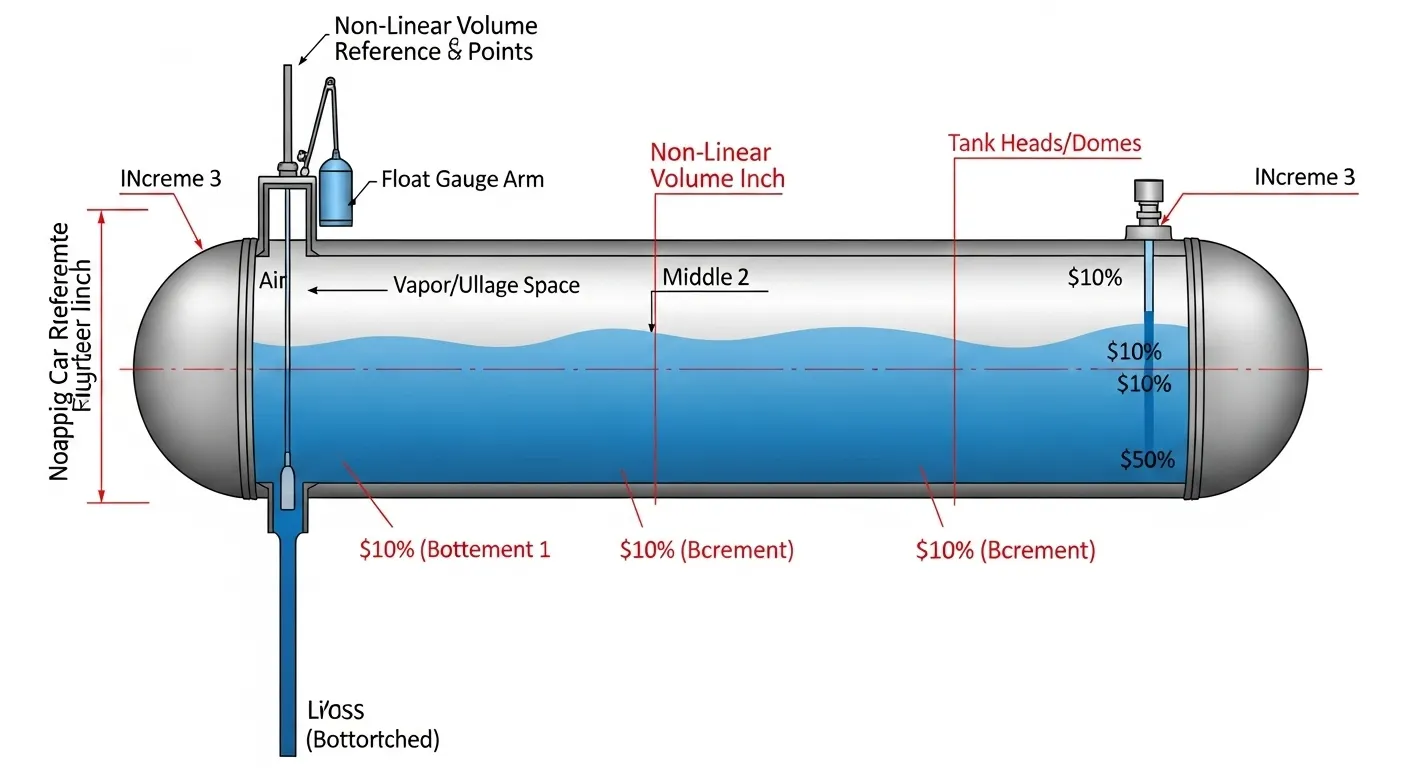
When a monitor receives raw data (say, a magnetic field strength reading from a Hall effect sensor), that signal must be converted into a usable percentage. This conversion process relies on a Strapping Chart. A strapping chart is a manufacturer-provided look-up table that details the precise volume of liquid at every single depth increment of a non-linear container, like an LP gas tank.
Because of the rounded heads (domes), one inch of liquid at 10% capacity represents far less actual volume than one inch of liquid at 50% capacity. The smart monitor’s firmware needs to be programmed with the correct strapping chart for your tank's specific dimensions (manufacturer, diameter, length, dome shape) to output an accurate reading. If the wrong strapping chart is programmed, the monitor will be inaccurate, and only a technician with access to the firmware can fix it.
Key Variables: Why Your Smart Propane Reading Can Be Wrong
If your smart monitor is acting up, the fault might not be the monitor itself. What I’ve found is that in nine out of ten cases, the deviation is caused by one of these four environmental or mechanical variables.
1. Temperature and Specific Gravity: Propane is Not Water
This is the most critical factor, especially for large industrial tanks. Propane is stored as a liquid, and like all liquids, its volume is highly sensitive to temperature.
- The Science: LP gas liquid density decreases as the temperature increases, meaning the liquid expands. When the temperature drops, the liquid contracts.
- The Impact: The smart monitor and the physical float gauge read the volume (how full the tank is), not the mass. A simple, unforgettable rule of thumb: LP gas volume changes by approximately 1.5% for every 10∘F change in temperature. This is why a tank showing 80% in the summer heat might drop to 75% overnight in a sudden cold snap—without a single cubic foot of gas being consumed!
- Expert Insight: Sophisticated monitors often incorporate a temperature probe and a compensation algorithm, but consumer-grade versions do not. If you are aiming for high accuracy (e.g., ±1%), you must manually account for temperature variation during your validation check.
2. Physical Float Gauge Tolerance
Remember, your smart monitor sensor is usually just reporting on what the physical float gauge on the tank is doing. The 'digital' reading can only be as accurate as the underlying physical mechanism it mirrors.
- Inherent Tolerance: Industry-standard physical float gauges inherently have a tolerance of ±3% to ±5%. They are mechanical devices subject to wear, friction, and environmental gunk.
- Wear and Tear: Over years of use, the float arm pivot point can stick, causing a lag in the physical gauge reading, which is then faithfully transmitted—and inaccurately reported—by the smart sensor.
3. Tank Settling and Level
Propane gauges, due to the critical importance of the strapping chart, rely on the tank being perfectly level, especially across the main axis.
- The Issue: If your tank has settled or is sitting on a slope, the liquid level relative to the gauge will be incorrect. An inch of liquid on one side may be an inch and a quarter on the other.
- Trustworthiness Check: If your property has been subject to heavy rain or ground shifting, check the physical level of the tank with a simple spirit level. It’s a basic step, but often overlooked.
4. Data Latency and Signal Interference
Sometimes, the reading is accurate at the tank, but the data transmission is the problem.
- Smart monitors rely on various signals (cellular, LoRaWAN, etc.) to report back to the cloud server and then to your app.
- Latency: If the transmission cycle is set to only report every 12 or 24 hours, the reading you are looking at might be stale.
- Interference: Heavy steel structures, concrete bunkers, or simply long distances can interfere with the signal, causing data packets to drop and the app to display the last known (and potentially hours-old) reading.
The Role of the Sensor Type
The most popular smart monitors use one of two main sensor types, and they have different implications for accuracy:
| Sensor Type | Measurement Method | Typical Accuracy Range | Calibration Dependency |
| Hall Effect | Attaches to the existing physical float gauge magnet and reads its position. | ±3% to ±5% | Dependent on the physical gauge's accuracy and the quality of the magnetic coupling. |
| Ultrasonic | Sits on the tank’s exterior bottom (or internal top) and sends a sound wave to measure liquid level. | ±1% to ±3% (More precise) | Dependent on the temperature compensation algorithm and clear internal tank walls. |
Export to Sheets
The key takeaway here is: If your sensor is Hall Effect, it inherits the mechanical limitations of your old gauge. If it’s Ultrasonic, its main challenge is temperature compensation.
The 5-Step Field Guide: Validating Your Smart Monitor Accuracy (A How-To)
Before you waste money calling a technician for a simple sensor mismatch, run through this five-step validation process. This is the exact procedure I’ve used in the field to diagnose the true source of an accuracy issue.
Step 1: Check the Tank Level (The Eyeball Test)
This is the true baseline. Safely locate the physical float gauge on your tank (usually under the dome/hood).
- The Reading: Note the percentage reading on the dial face. This is the definitive, primary measurement.
- The Wait: If the tank was just refilled or had a heavy usage period, wait 30 minutes for the liquid level to stabilize.
Step 2: Cross-Reference the Physical Gauge to the App
With the physical reading in hand, open your monitor’s app or online dashboard.
- Note the Deviation: Record the physical reading and the digital reading side-by-side. The difference between the two is your raw deviation.
- Data Latency Check: Look for the "Last Reported" timestamp on the app. If the time difference is more than 6 hours, try refreshing the app and checking for a "Force Update" or "Manual Ping" feature to get the freshest data.
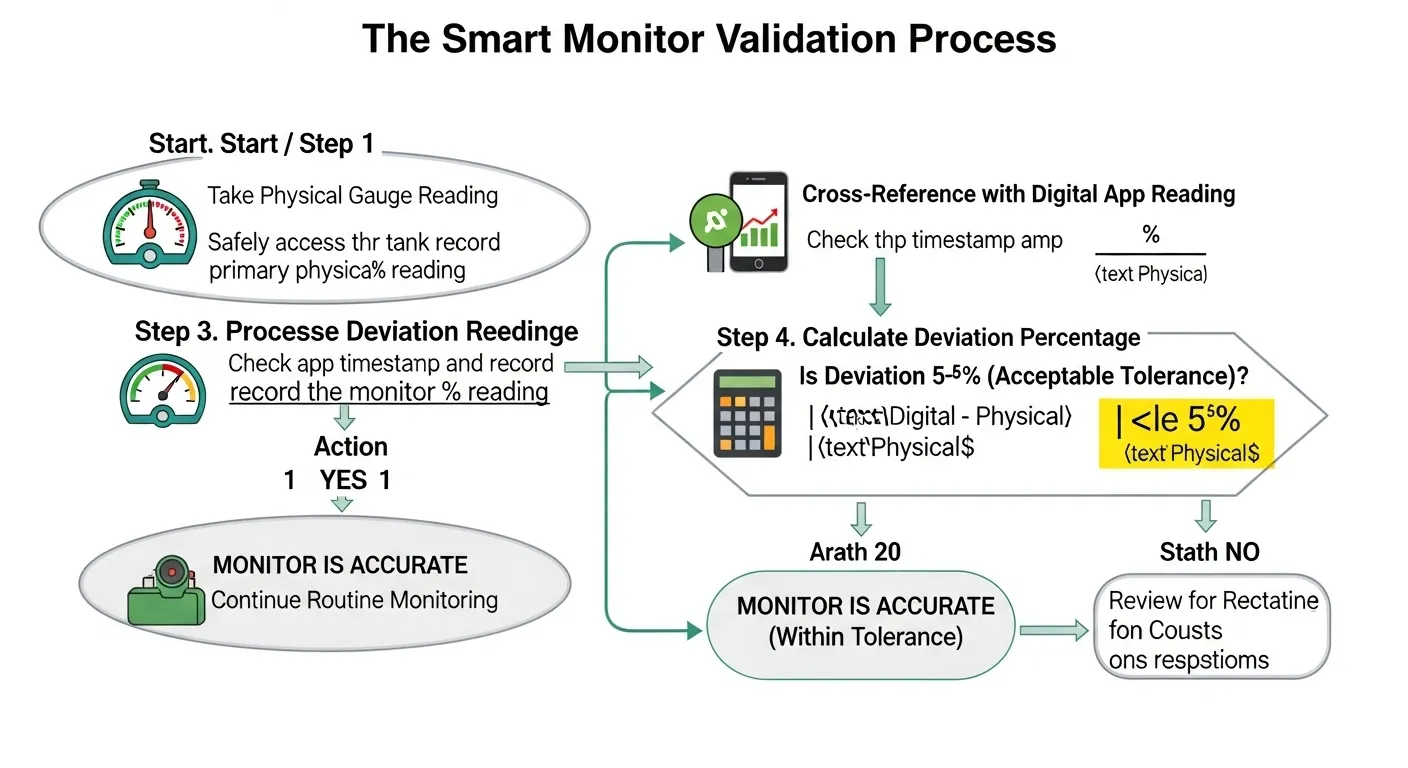
Step 3: Calculate the Deviation Percentage
This calculation determines if the deviation is within the acceptable industrial tolerance (±5%) or if you have a serious problem.
Deviation(%)=Physical Reading∣Digital Reading−Physical Reading∣×100
Example: Your physical gauge reads 50%. Your monitor app reads 53%. 50∣53−50∣×100=503×100=6% Deviation. The Bottom Line: A 6% deviation is too high and requires further action.
Step 4 Deep Dive: Accounting for LP Gas Temperature
For professional validation, you should factor in the temperature correction, especially if the current temperature is outside the 50∘F to 70∘F range.
- The Process: If your tank is 90∘F (summer heat), the volume is inflated. You need to mentally subtract a small percentage. If it's 10∘F (winter freeze), the volume is contracted, and you should add a small percentage to the digital reading before calculating deviation.
- Actionable Step: If the deviation is corrected by the temperature factor, the monitor is physically accurate but not temperature-compensating—a key piece of information for your supplier.
Step 5: Decision Time
Based on your calculated deviation and the temperature check, you must make a decision:
- Deviation is <5%: The monitor is within acceptable commercial tolerance. The issue is likely the minor physical gauge friction, or you're simply seeing temperature fluctuations. No action needed, but monitor closely.
- Deviation is ≥5%: The reading is systematically inaccurate. The monitor is likely programmed with the wrong strapping chart, the sensor is damaged, or the firmware needs re-initialization. Time to call for professional calibration.
When Professional Calibration is Necessary: Firmware and Diagnostics
You've validated the reading and confirmed a persistent deviation of 5% or more. What happens next? You're entering the territory of true calibration, which requires proprietary tools and expertise.
Why You Can’t DIY the Firmware
A smart monitor doesn't have a simple reset button that clears the calibration. The calibration data—the strapping chart and the sensor’s zero and span points—are hard-coded into the device’s internal, non-volatile memory. To change this requires:
- Proprietary Software: The technician uses a manufacturer-specific laptop program or handheld device.
- Specialized Connectors: They connect directly to the monitor's diagnostic port, often using a weatherproof, sealed cable.
- Authentication: The monitor typically requires a unique access code or key to prevent unauthorized tampering that could lead to dangerous overfills.
In my experience, if the deviation is >5% after multiple checks, the issue is often the monitor's memory/firmware, not a simple sensor error.
Two Reasons for Calling a Professional
- New Monitor, Old Tank: You've upgraded the smart monitor on an existing, older tank. If the technician simply swapped the hardware without properly loading the existing tank's specific strapping chart into the new monitor’s memory, the math will be wrong.
- Drifted Calibration: The Hall effect sensor has shifted slightly over time, or the internal electronic components have drifted out of tolerance. The technician will perform a two-point calibration—setting the zero point (empty) and the span point (full) to match the known physical parameters of your tank.
Cost vs. ROI: Justifying Professional Calibration
Many operations managers hesitate at the thought of a $100 to $300 service fee for calibration. But the return on investment (ROI) is immediate and clear.
- Refill Optimization: With ±1% accuracy, a commercial facility can wait longer between fills, buying gas when prices are lower, and never ordering emergency "hot shot" fills.
- Preventing Run-Outs: For critical systems (heating, manufacturing processes), the cost of calibration is a fraction of the cost of a single run-out event.
- Safety and Compliance: Accurate calibration ensures you comply with the safe fill limits mandated by federal and local standards, minimizing the risk of an over-pressurization incident.
Conclusion: Precision is Profit
You rely on precision engineering in every other part of your manufacturing or commercial process—your propane supply chain shouldn't be an exception. A smart monitor is only "smart" when it is accurate.
Here are the key takeaways from a practical standpoint:
- Validate, Don't Calibrate: Your job is to validate the monitor against the physical gauge using the 5-step process.
- The 5% Rule: If the deviation is persistently ≥5%, the solution is firmware calibration by a certified professional.
- Check the Physics: Always remember the non-linear nature of propane volume measurement (strapping chart) and the impact of temperature correction.
By integrating this professional-level validation into your routine maintenance checklist, you transform your smart monitor from a consumer gadget into a reliable, industrial-grade tool. If you found a systematic error today, it’s time to pick up the phone. But before you do, make sure to check out our in-depth article on common sensor failures to provide your technician with all the necessary background information.
Call to Action: Now that you know how to test the accuracy, discover what to do when your monitor gives you a confusing number. Read our complete guide: [Troubleshooting Propane Tank Level Readings ]
Frequently Asked Questions (FAQ)
Re-zeroing simply resets the current digital reading to match the physical gauge reading, usually used after a short period of drift. True calibration is a deeper, technical process that permanently adjusts the monitor's internal firmware algorithm (the strapping chart) to match the tank's physical specifications. Re-zeroing is temporary; calibration is a permanent programming fix.
For most commercial applications, true calibration is generally only required once when the monitor is first installed on a specific tank. Routine re-calibration is only necessary if the tank has been physically moved or if the monitor shows a persistent, significant drift of ≥5% after several validation checks. We recommend validating the accuracy quarterly.For most commercial applications, true calibration is generally only required once when the monitor is first installed on a specific tank. Routine re-calibration is only necessary if the tank has been physically moved or if the monitor shows a persistent, significant drift of ≥5% after several validation checks. We recommend validating the accuracy quarterly.
Propane (LP gas) is a volatile liquid whose density changes significantly with temperature. As the temperature rises, the liquid expands, making the volume (and the reading) look higher. Conversely, cold temperatures cause the liquid to contract. A highly accurate monitor must have a temperature compensation algorithm built into its firmware to adjust the reading for these volume changes.
A strapping chart is a detailed look-up table that correlates liquid depth to actual volume for a specific tank model. Since propane tanks have rounded ends (domes), an inch of liquid at the bottom of the tank holds far less volume than an inch of liquid in the middle. The strapping chart is the key piece of data that allows the smart monitor’s algorithm to convert raw sensor data into an accurate percentage reading.
Yes, in most cases, but you must ensure the monitor's sensor is compatible with the tank's existing float gauge head. More importantly, the technician must program the monitor with the correct strapping chart corresponding to your tank's size and manufacturer. Failure to do so will result in systematic inaccuracy, no matter how good the monitor is.
For non-temperature-compensated consumer-grade monitors, the acceptable accuracy tolerance is typically ±5% due to the inherent mechanical limitations of the underlying physical float gauge. For professional, temperature-compensated systems, the target tolerance is often much tighter, aiming for ±1% to ±2% to facilitate precise commercial inventory management.